The SciPy Conference for 2021 is over. It was great! About 1000 people attended, which is in line with the annual growth rate, although last year was a bumper crop year with 1,500 attendees. Videos are available on YouTube. I've linked some of the playlists above.
Of note was a presentation by Artash Nath, a 9th grade high school student in Canada. He presented a fully fleshed out machine learning project using Seismic vibration frequency data to analyze Covid-19 lock-down compliance across various Canadian cities. He was very inspirational. His advice to new machine learning students was notable. His advice: Find something you are really interested in, then persevere. Next, you have to do projects to learn. Taking classes is not enough. From doing one very simple project, I learned so much more than from taking one class.
Artash Nath, "Using Python to Measure Seismic Silences..."video-Artash
I was also impressed by a napari image viewer library demo. It used satellite images to analyze drought conditions in Australia during Summer and Winter seasons. It's a high powered tool to manage very large image data with low latency. I think it will be extremely useful for our Amazon Rainforest deep learning group project.
Dana Pop, "Big data, low effort: out-of-core visualization with the napari image viewer"video-napari-demo
At our local meetup, I presented a visual explanation of the random forest model. Based on Rachael Thomas at Fast.AI and other bloggers, who say that an idea that stays in my computer is worthless, while even a simple or minimally developed idea posted to the internet can be highly valuable, I am posting this random forest slides to my blog. Hope this will help someone. :-)
We also have a very good local Meetup in Sterling, Virginia. We're meeting virtually via Google Meet during the pandemic. We study data science and machine learning together, and help each other with project support and moral support. It can be lonely being a self-taught data scientist, so please come and join our Meetup. See link above.
I noticed that I have not posted blog entry for a long time. I've been busy studying the fast.ai deep learning class. This year, I am also preparing for Data Scientist job interviews. I started a major project with two others from my Meetup. Amazon Rainforest satellite image analysis using Planet Labs's high resolution images. Data is being provided for free to researchers during 2020-2022 with funding coming from non-profit organizations concerned about the rapidly accelerating deforestation of tropical rainforests.
I am back on HackerRank.com in 2021. I tried it several years ago to practice simple Python syntax, but I was put off by the Java centric instructions and example code, even for Python 3 practice sections. Now I am back on. Python 3 instructions look like Python and correct answers are also Pythonic. User Interface design could still be easier. Too many extra buttons and pop-up boxes with same white background as the main page. So too easy to click away to another part of the website when all I want is to go to the next challenge question. Still, much improved for Python 3 code.
I decided to do a lot of coding challenge questions because I tried 4 easy algorithm type of questions from Udemy's interview prep class, but I couldn't get the simplest one to work. I think it's not that I don't know how to code, but I need recent practice in how to think about these easy algorithm type of questions. I may also need a refresher on logic problems. When to use "if-then" vs "while" loops and when indexing by integer is better than iterating over items in a collection. For i in range(0, 13) vs for char in word. So, if I am using the index number in my calculation, I need to loop over the integer and not by item, which will return a type error. =-K
I am posting a summary of my own learning experience in the hopes of helping other students of data science. This is a journey where I continue to make adjustments to my study program along the way. I have a relatively technical background. I studied statistics, econometrics and financial derivatives in school and continued to actively use my skills in these areas for ten years or more at work. I took more math classes while working that I could not fit into my schedule while in school. I taught myself enough Microsoft VBA to code a financial instruments trading analysis project for work, and taught myself SQL relational database to be a consultant to a small business for many years. I had even taken 3 college-level programming classes at different times. However when I began seriously studying Python and data science, my biggest difficulty was in remembering what I was studying on Python syntax and basic operations. My lack of formal understanding about computer programming concepts was a large hurdle to overcome. My eyes will glaze over syntax symbols, and I could not figure out when something should be invoked using a ( ) and when an exactly same object or a very similar object should be invoked using a [ ]. It was more confusing because I was trying to study R and VBA at the same time as Python, and these programs used [ ], ( ) and { } for different but somewhat similar purposes. It was like I had a partial color blindness, and I was being asked to reliably pick out orange dots from red dots on the screen. After getting advice from several sources that I need to focus on one programming language in the beginning, I focused only on Python and Python Data Science libraries for one year. After that first year, I could tell reliably when I should use a [ ] "bracket notation," and when I should use a ( ) for a function call or a "dot method" call to a class object or method. I felt a huge sense of relief when I got over this hump. I began to feel a confidence that I can really do this.
In July during SciPy 2020 Conference, I felt my confidence building about my basic Python data science skills. I could see how far I have come since SciPy 2018 Conference. Finally, I felt I had reached a minimum viable skill level to be conversant in this new domain. In detail, this means I was confident in my skills at using the Python standard library, NumPy, Pandas, Matplotlib and Jupyter Notebook. I had enough skills to use Scikit-Learn, PyTorch and Tensorflow as long as I can look up information online. I had one year of daily experience at using related tools, i.e., Ubuntu bash commands, conda virtual environments, Git and Github commands and Markdown formatting. And I had sufficient recall of basic machine learning concepts and related math, probability and statistics to be able to discuss them during a future interview.
Time invested in Python Data Science was 1.5 years of concentrated effort at 8-12 hours per day for 5-6 days per week, with a couple of weeks off for personal time. In an earlier 6-month period, I invested time studying VBA, R and HTML/CSS/javascript along with Python. Combined concentrated study time invested was 2 years. Calendar time elapsed was 3 years.
I believe I am qualified to begin applying to junior-level data scientist jobs. But I have decided to invest 6-12 more months honing my skills in deep learning and doing my own data science projects. I have been studying Coursera Deep Learning AI classes with a local Meetup and want to finish it, as well as take fast.ai's revamped version 2 deep learning classes. I also feel that I have only recently attained sufficient skills to run interesting experiments on my own. And I want to demonstrate my skills in personal projects rather than only talking about my data science skills at the next job interview. I plan to apply to a few junior-level openings every month, but my major job search push will come later.
Dear Reader, if you are starting out learning to code and learning data science, I hope this post will be helpful to you. :-D
Reboot of fast.ai - Deep Learning Course, Software, and Book
There's a reboot to fast.ai, v2, that seems very good. Jeremy Howard has refactored the fastai software (higher layer on top of PyTorch), released a book, and released March 2020 free class on YouTube. Seems much better, more concise, and code has been split out into separate packages for easier use outside of the classroom. They were released on August 21, 2020, so please go check it out. :-)
In addition, you may be interested in Lex Fridman's interview with Jeremy Howard in August 2019, where Jeremy describes his thoughts on deep learning, software development, and why he is using SWIFT in addition to Python for deep learning going forward.
Lex Fridman interview.
All ten tutorials from SciPy 2020 are available now on YouTube. My top tutorial from the conference is PySAL. I have been trying to use this group of packages for studying the geography of socio-economic inequality. PySAL works along with geopandas and geosnap. I may have finally understood enough of the material to start to make progress with it. Other tutorials of note are Bayesian Statistics, PyTorch from Scratch, and Dask for easy parallelism.
I didn't like the numpy tutorial with a matplotlib intro. (See numpy tutorial from SciPy 2020.) It may be fine for some people, but I found it very distracting. Instructor chose to use an ipython shell and directly type code in it rather than a pre-populated Jupyter notebook. There is a PDF file, with 2 slides per page in portrait view. The PDF would have been easier to navigate on-screen if it was saved 1 slide per page in landscape view. I had to constantly scroll and zoom in & out on my screen to read the PDF, while also having a shell open in 2nd window and the live video open on 3rd window. I didn't like the teaching format. Content is very good for beginners. The PDF is good for self-study outside of the live tutorial format.
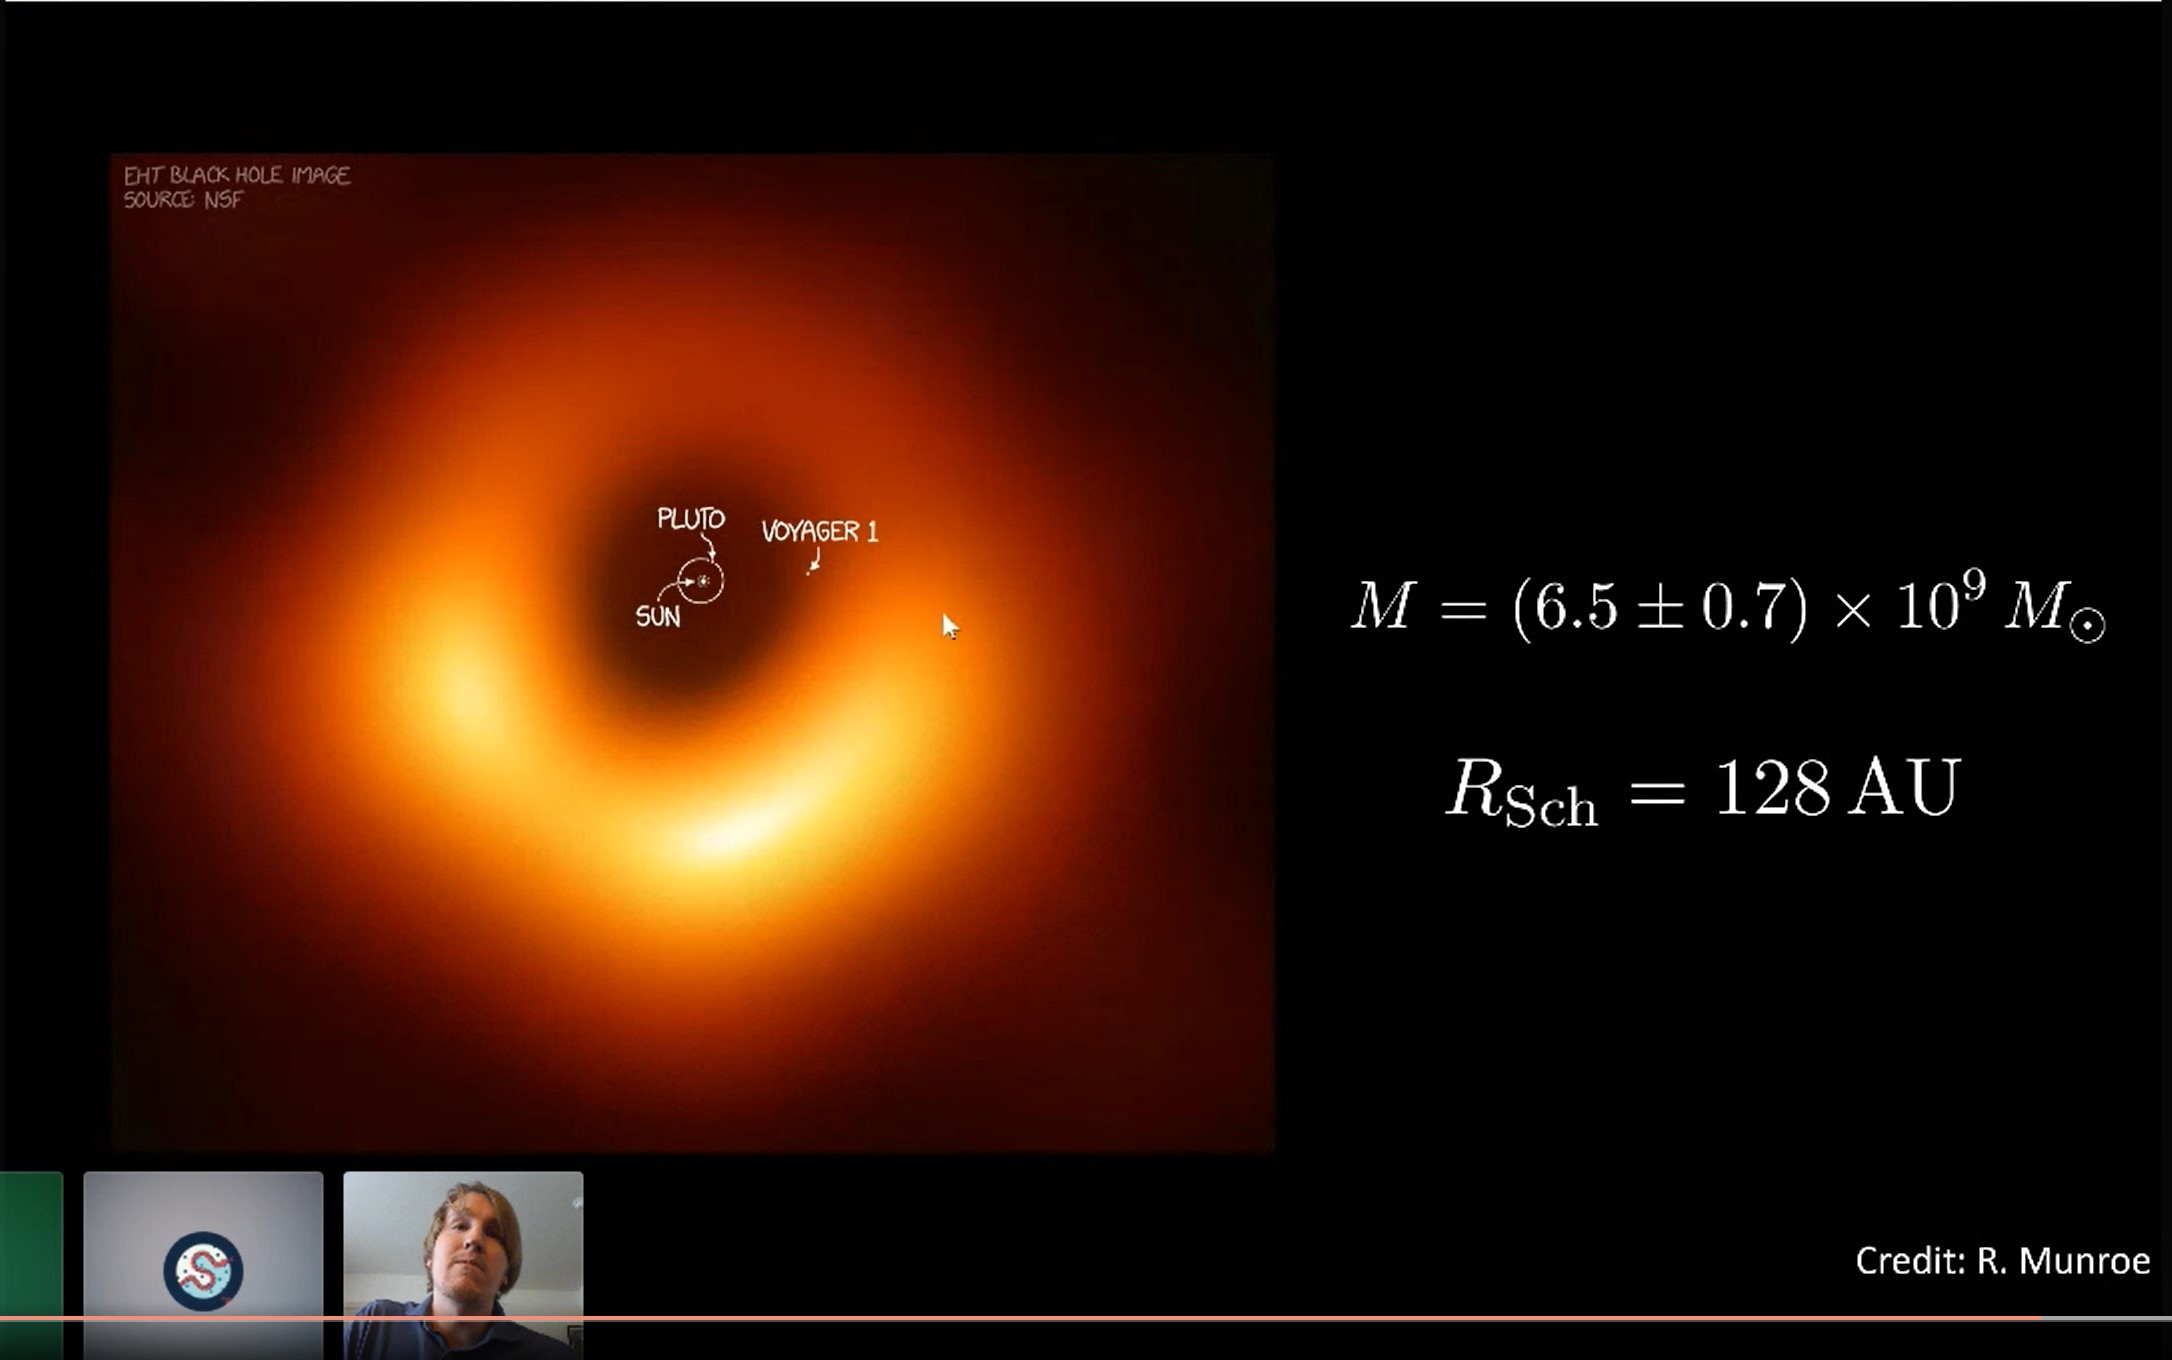
SciPy 2020 Keynote, First Image of a Black Hole by Event Horizon Telescope (EHT) Team
Date: July 18, 2020
Keynote EHT team video. Main talk starts at 18:00 minutes by Dr. Andrew Chael.
I am writing this post in the middle of this tutorial. SciPy virtual conference is going great! :-D Amazing how well it is going since it's the first virtual conference during the time of Covid-19 Pandemic. YouTube will have the corresponding video open to the public, maybe in a few days. There are 3 pre-recorded sets of videos already available from Enthought on YouTube. More playlists on biology will be released tonight at 6PM ET. Enjoy! :-D
A good, recent interview of Andrew Ng. He is a co-founder of Coursera.org. He has taught DeepLearning.AI classes on Coursera during the past several years. His interview comment that he likes to take handwritten notes to learn was interesting. He summarizes what he is listening to rather than writing everything down verbatim. This helps him slow down and actively use his mind to make each concept concrete. Interview was posted on YouTube on Feb 20, 2020.
A Good Book about the daily life of a software developer
There are many YouTube videos out there that say you can become a software developer or a data scientist with a concentrated self-study in 9 months. There are also many boot camps that promise a $100,000+ coding job after finishing their 6-9 months program that costs $20,000 - $30,000. How realistic is the 6-9 months self-study plan or boot camp program? And even after you did all that work and paid the money and got the job, how do you know if you will be happy with your decision?
That's where this book comes in. YouTube videos can't provide the kind of deep, fact-filled analysis that a full-length book can. The author uses his own experience from working at various programming jobs after graduating from CMU with an engineering degree. He also uses the experience of his college friends and work friends to tell a more holistic story. I listened to the entire book over 2 days. I found it very helpful. While I am focused on a data science career, which is somewhat different from software development, I found it easy to apply the book's lessons to my situation. If you are contemplating a career in software or related fields, I highly recommend this book, Software Developer Life by David Xiang.
Now My Opinion
OK, now this is my own summary and opinion after having watched many, many YouTube videos on getting a job in software or data science. If you are most interested in getting a $100,000+ job in the shortest time possible, and you have a non-technical background (i.e., you don't have an engineering, statistics, math, or finance degree, a computer science bachelors or masters, or a PhD in math or physics), then your best chance comes from moving to Silicon Valley and going to a well-known boot camp for a Front-End Web Developer. Next using your newly acquired Silicon Valley network, send out job applications to large companies with plenty of money, e.g., Uber, Netflix, YouTube (Google), Facebook, and Apple. Your success rate will be 50% as of 2018 boot camp graduating class and declining. But this is still the best success rate available for non-technical people willing to study really hard during the boot camp and hustle like mad afterwards to land that first job. And if you get hired, you will make $100,000 to $115,000 as your starting salary. This option may not be possible for many people. The living cost in Palo Alto or Mountain View is astronomical. It REALLY helps if you can sleep on someone's couch for free. A tent on someone's backyard costs $1,000 to $2,000 a month to rent. Oh, and the average job search time post boot camp seems to be 4-6 months (for the 50% who were successful), and you will need to continue to support yourself during that time.
For those with a PhD in Math or Physics, they seem to go for a Data Science position. It is highest paying without moving to Silicon Valley. They seem to take about a 1 to 1.5 year for study and job search with about 6-9 months of it full-time after quitting their job. Their starting salary seems to be around $90,000 to $125,000 and is primarily dependent on location. Big cities pay more. There is no information on the number of people with PhDs who failed to land a job as a Data Scientist after putting in the effort. These are highly intelligent and motivated people and most of them already have jobs. So I would guess the successful transition rate will be lower than for the boot camp students who are all-in. Maybe 30% is successful?
For someone between the two above options, there is the low-paying or slow route. Many people with no technical degrees have successfully transitioned into Front-End Developer jobs after 1 year of full-time study, mostly via some form of formal schooling. Starting salary outside of Silicon Valley ranges from $35,000 to $50,000. Big cities pay more here too. If you want to become a Data Scientist and you have not programmed before, it will take longer. I am guessing about 2 years of full-time study to become competent in standard Python and Python data science libraries and machine learning concepts and related math. If you have not taken classes in calculus, linear algebra, and probability, you may need to add 6 months. By that time you will know enough to build a data science portfolio, which may take another 6 months. Job search will also take about 6 months, but some of this can be done concurrently while building up your portfolio.
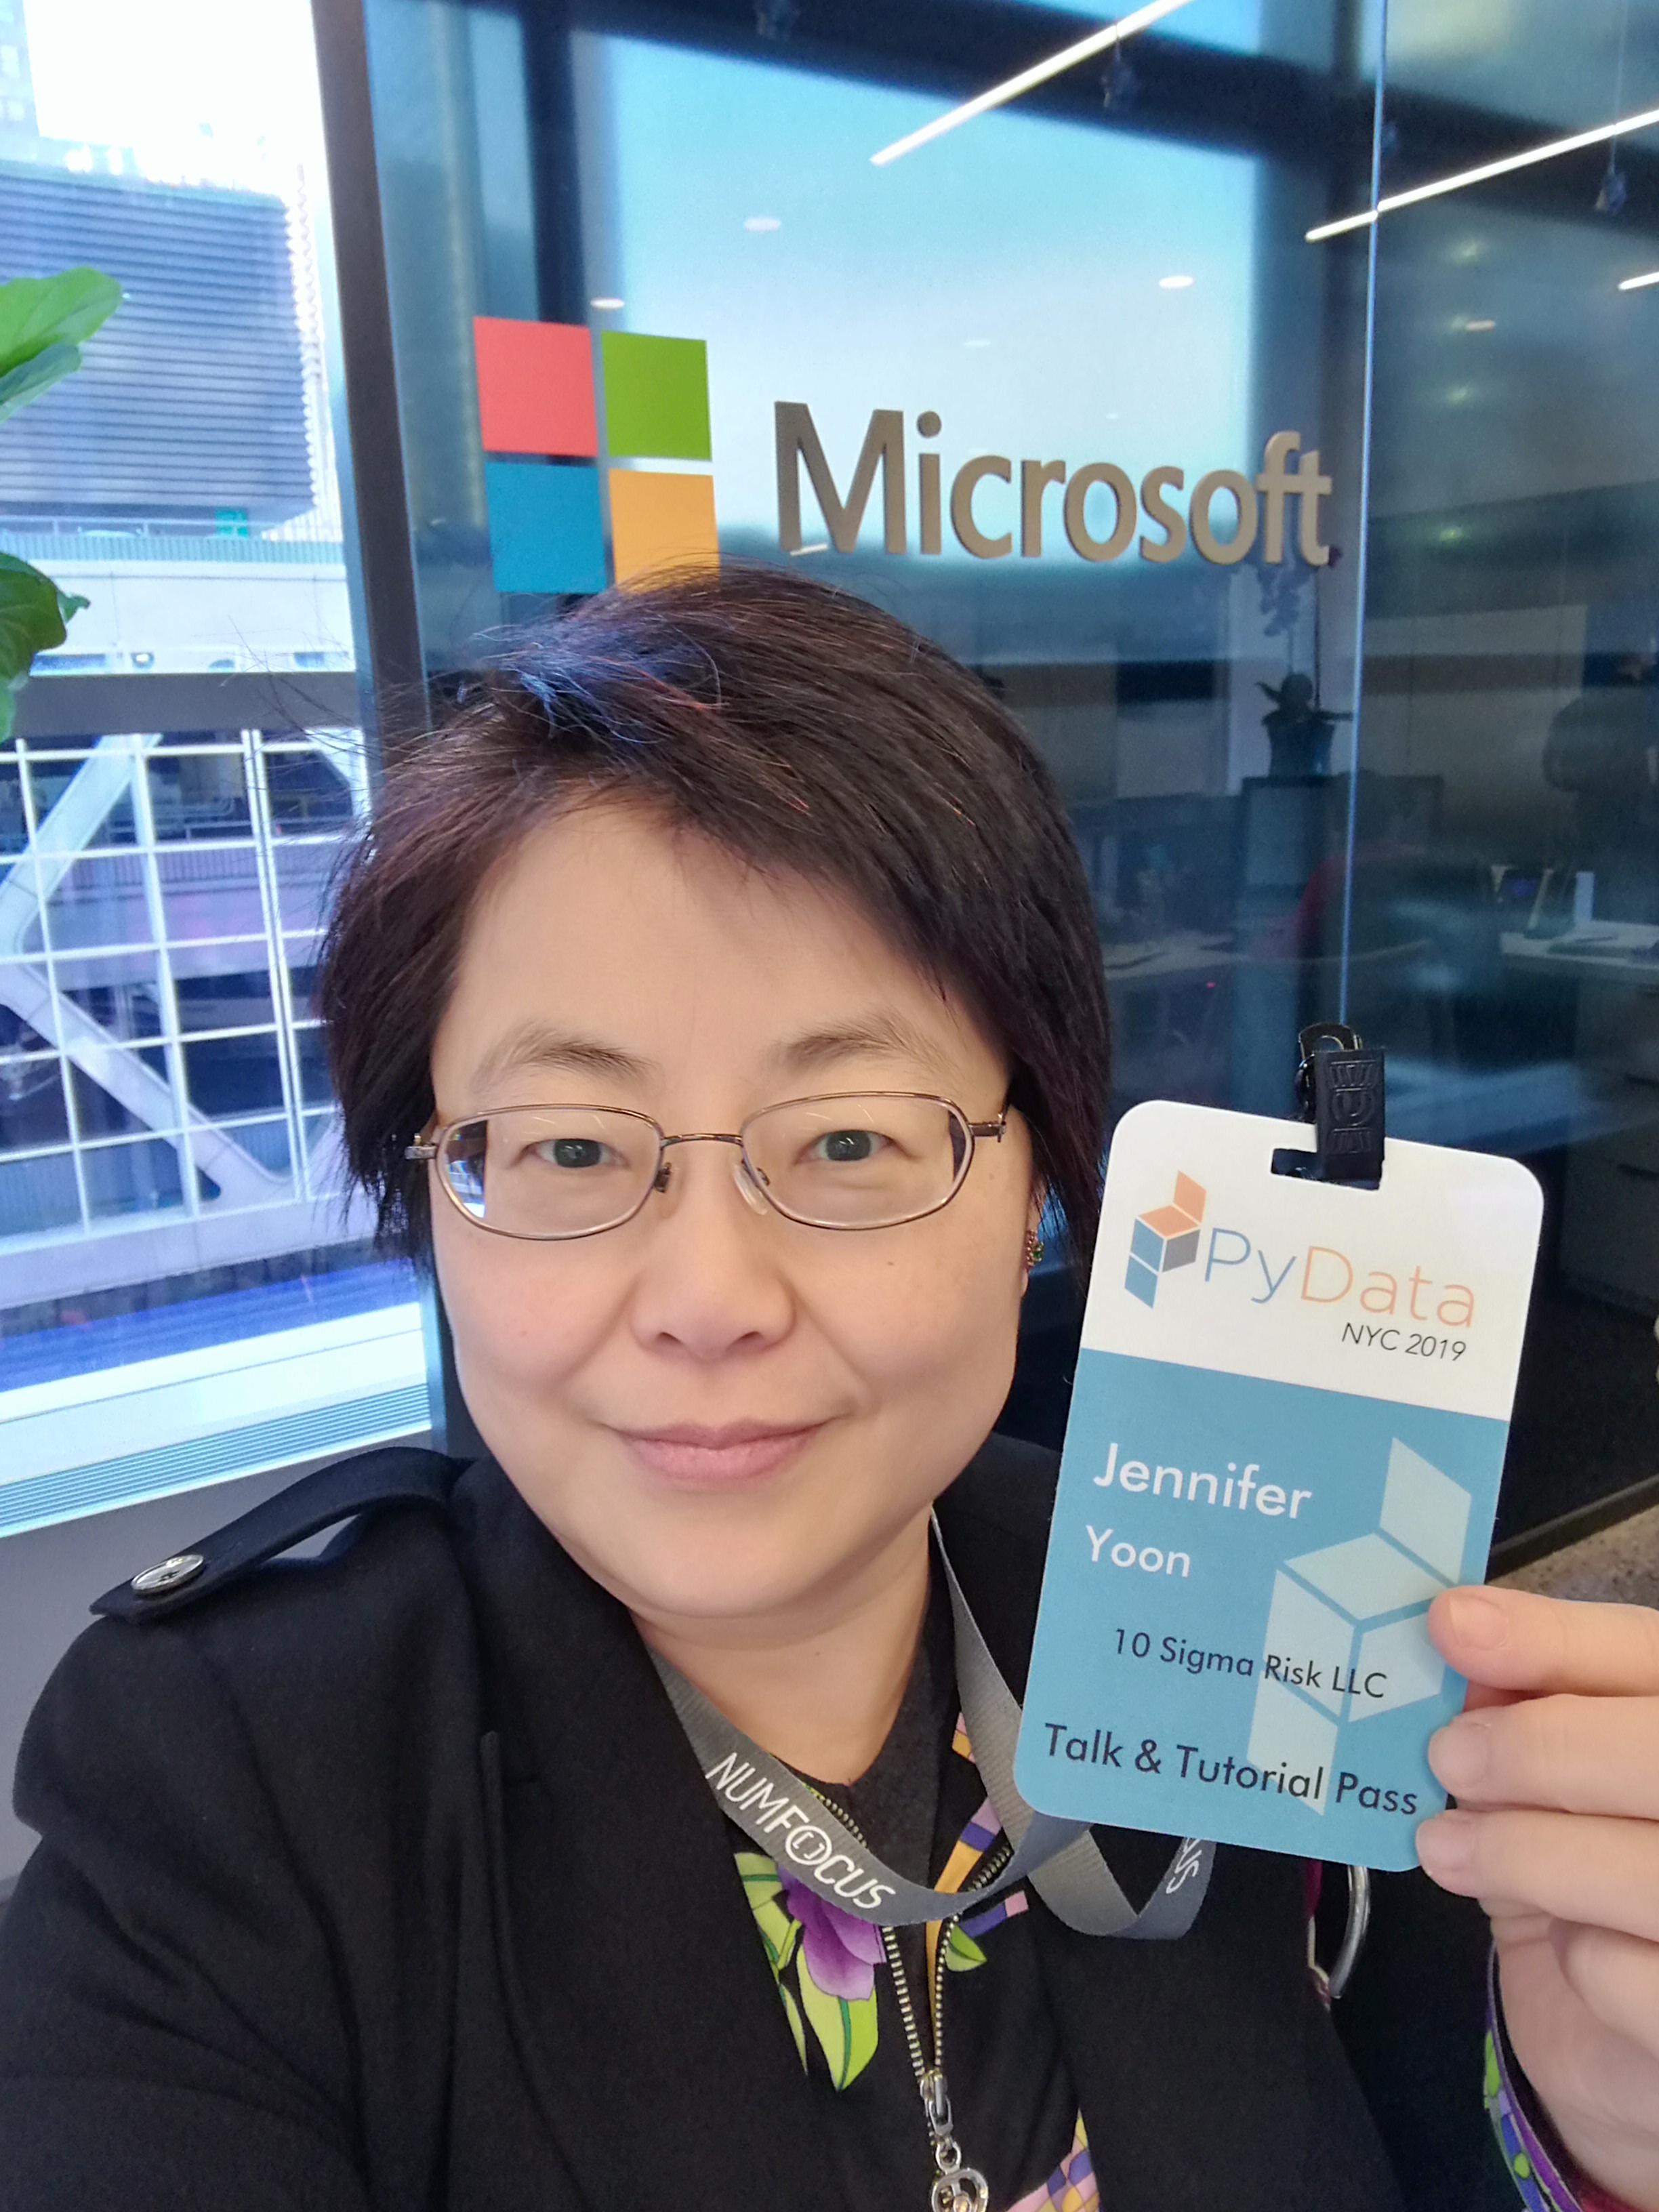
I attended the PyData NY 2019 conference this week. It was a wonderful learning opportunity. I especially enjoyed the tutorials. (See below my selfies at PyData and Time Square, New York City.)
Tutorials of Note:
Michoel Snow, Hacking the Data Science Challenge (interviewing):
Abstract 1
and Github 1.
Carlos, Afonso, Visualizing the 2019 Measles Outbreak in NYC:
Abstract 3 and Github 3.
Bayesian Statistics:
I also heard about a new Bayesian approach to Statistical Inference that
sounded interesting. There is a free class taught by Professor Richard McElreath, Statistical Rethinking: A Bayesian Course with Examples in R and Stan. I had a friend who was doing his PhD on the Bayesian Approach to Statistics. What I remember is that this approach makes a richer use of prior knowledge and estimates and finds ways to use them directly in the statistical model. Professor McElreath emphasizes that being able to reject a null hypothesis does not necessarily lead to our goal of positively accepting our research hypothesis.
"Rethinking: Is null hypothesis significance testing (NHST) falsificationist? NHST is often identified with the falsificationist, or Popperian, philosophy of science. However, usually NHST is used to falsify a null hypothesis, not the actual research hypothesis. So the falsification is being done to something other than the explanatory model. This seems the reverse from Karl Popper’s philosophy." (See Statistical Rethinking book, page 5.)
While I was at the NYC PyData Conference, I discussed a book for using
Machine Learning to make money in 2019. The book is called Advances in Financial Machine Learning, by Marcos Lopez de Prado, c 2018 from Wiley.
It is a very opinionated book. And I don't agree with many of the author's views.
But it offers an interesting look inside the mind of a hedge fund manager trying to use Machine Learning to make money in 2018. The author pans natural language processing to conduct sentiment analysis on earnings calls or satellite image processing to obtain product delivery or sales quantity estimates. The author thinks the low hanging fruit from those methods are gone. He believes in processing raw trading data from the exchanges to discover trading fingerprints of humans vs algo traders, as well as other classes of traders. This can be used to create spread trading strategies where one class of traders can be expected to outperform another class of traders, under specific economic conditions. The Machine Learning part is used to automate raw data processing, where huge volumes are processed for the small nuggets of silver.
The code used in book examples seem to be Python, but without PEP8 styling. A group of people have tried to translate the author's code examples into fully finished coding exercises. See Github link above.
Update on Long-Term Capital failure:
Originally in my chat with other attendees at PyData NY where I discussed this book, I was also explaining my take on the Long-Term Capital failure, and why I thought that they failed in an unusual way. Since then, I already got 2 posts from people commenting on the Slack channel.
In brief, I read in an article that Fisher Black told someone close that the reason he decided not to join Long-Term Capital was because he thought their strategy boiled down to shorting liquidity. I have no way to verify whether he said this. However, after many years of thinking about it, I came to agree that LT Capital failed primarily because they were short liquidity. This is unusual. Most failures are primarily due to market risk or credit risk. Although almost all failures do have a liquidity risk component, this is a short-term effect caused by deteriorating asset values. In most failures, the main invested assets are later discovered to be fundamentally flawed and loses significant value. This did not happen in the LT Capital failure. The fund ran out of time, but the bulk of the positions were later sold at a profit. The instigating event was probably the Russian government's decision to devalue its currency and default on its government bonds, while simultaneously enforcing a bank freeze on all assets held inside its border. The NY FED lead an effort to arm-twist major banks, who were investors in LT Capital, to allow it to take more time to resolve its obligations. The regulators were very concerned about systemic risk. Some people believe this FED action added to moral hazard, and may have contributed to the Market Crash of 2008. I think we can only have an imperfect understanding of what happened then, and all of its interconnections and ramifications, even though this case has been extensively studied and reported on.
Incidentally, you may also be interested in the book, When Genius Failed: The Rise and Fall of Long-Term Capital Management (Amazon).
Woohoo! It's Octoberfest for Hackers again. Register and submit 4 pull requests.
Get started on creating a habit of frequent Github commits. The first 50,000
participants to finish gets a free T-shirt from Digital Ocean. Last year, I got reacquainted with Github through this Hactoberfest and a little help from NOVA Women Who Code.
Update: I finished my four pull requests on October 25, 2019, and was able to get my Hactoberfest 2019 t-shirt from Digital Ocean.
This year about 60,000 people finished the challenge, and only the first 50,000 got t-shirts. So I was lucky to get one. (My t-shirt arrived yesterday, Nov 14, 2019, yeah!!!)
I also submitted a pull-request to geosnap, which is a neighborhood economic analysis package. I had more trouble with this repo because I am unfamiliar with the code base. See Github geosnap repo.
Understanding Convolutions - Otavio Good's talk on Word Lens
Date: August 19, 2019
Otavio Good's talk on Word Lens at O'Reilly AI conference, Sept. 2017
While studying deep learning with fast.ai, I came across a really good video that demonstrates a convolution in action. In a convolution layer, a small grid crawls across the source image to produce an output image layer that is a combination of a source and a filter array. Each small output area is a dot product of a small scanned input image area and the filter. The filter (also called kernal) is most often a 3 x 3 array of numbers. These frequently represent vertical, horizontal, or diagonal filters. These filters themselves are products of previous machine learning steps. Watch Otavio Good demonstrate how a convolution layer recognizes the letter "A."
Google acquired Word Lens app and the development team in May 2014. It's now part of Google Translate. It can translate written signs and text (not hand writing) using your phone's camera in real-time. It's really handy when travelling and trying to make sense of foreign language public signs on the street and at museums. ;-)
My Books in August 2019
Date: August 15, 2019
This is the current state of my coding bookshelf. On the top shelf there are financial coding, Python & R machine learning, coding interview, algorithms, and financial modeling books. Bottom shelf has references for R and C++ coding, financial risk management, and statistics, probability, and stochastic calculus. I like to study from several different books on the same topic. I find that different authors have varying approaches, and they work best in combination. Jake VanderPlas's Python Data Science Handbook (c 2017) is still my best book for learning Python data science libraries. It's my go to book for Numpy, Matplotlib, Scikit-Learn, and Jupyter Notebook (for %magic and !shell commands).
Quantum Computing, 2019 National Academies Study
Date: March 30, 2019
National Academies of Sciences, Engineering, and Medicine, 2019, Quantum Computing: Progress and Prospects, Washington, DC. https://doi.org/10.17226/25196
Scientists estimate the time to a working commercial quantum computer at 10 years to maybe never. Error correction needs of qubits pose unknown challenges. A free downloadable study on the state of quantum computing is available from The National Academies Press.
Easy Explanation on How A Quantum Computer Works
Date: March 20, 2019
This is an old video dated 2013, but has an easy to understand explanation on how a quantum computer works. 2^n is the number of information bits that can theoretically be combined. 2^300 is supposed to be a greater number than the number of [atoms] in the universe. But this is only useful for calculations that can make use of the super-position state. Also, for reading the final result, the quantum computer must drop back out of the super-position state into the normal state. For normal calculations, the quantum computer is projected to be slower than a regular computer.
Beginning of Probability Measure Theory
Date: March 20, 2019
I think one of the most confusing and difficult part of learning probability measure theory comes at the very beginning! Obviously this project is going to be very opinionated. :-) DeMorgan's Laws and other rules for calculating probabilities, which comes after the beginning, are not that different from normal algebra. I think most people can follow along and understand the other parts, if they do not make the mistake of getting forever stuck on the starting definitions! We need to rename "probability space", "sigma-algebra", and all those greek letters, to something more English-like and easier to remember. Anyway, I plan to post a very opinionated translation from Greek-Math-speak to Normal-English-speak.
Next Meetup: Convolutional Neural Networks for Visual Recognition, by Stanford University, Chp 1 and 2. CS231n
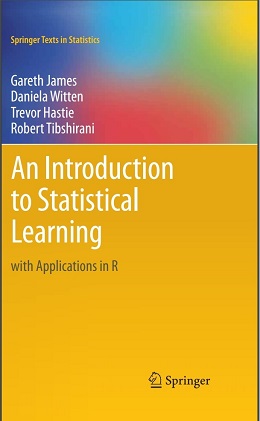
Reference: Gareth James et al., An Intro to Stat Learn with R. ISLR-website
I gave my first short talk on a data science subject to a local Meetup group this week. Here's a shout-out to the group,
Serious Data Science. Thanks Deborah, Julius, Elsa, Peter, Dan and others. You guys are so supportive and kind! I don't think I would have read the ISLR book with such attention without all of you helping to keep my motivation high! :-) If you, Reader, live near Sterling, Virginia, please come and join this wonderful Meetup group. We meet monthly on the 2nd Tuesday evenings at REI Systems Inc building.
GARP 20th Conference in NYC
Date: February 24 - 27, 2019
I will be in NYC attending the 20th GARP Risk Conference. The agenda has several sessions on machine learning and AI along with the usual risk topics. I am interested in learning more about how data science and AI is being using by financial institutions. I will also catch up with my former colleagues from the SEC while I am there. Glad the scheduling worked out.
PyData DC 2018 and SciPy Austin 2018
Date: November 20, 2018
Attended the PyData DC 2018 conference in Tysons Corner, VA over the weekend. I thoroughly enjoyed it. Everybody was very nice and welcoming towards relatively new programmers, like myself. I will post a write-up about several talks/software that caught my attention. This conference was more accessible for me than SciPy in July 2018 at Austin, TX. I come from a business background and have been learning Python and Data Science for only about 1.5 years. Many of the people I talked to at PyData had similar backgrounds. The SciPy community was more deeply into core python package development and were more advanced programmers. The majority seemed to have PhDs in a hard science or math field. For me personally, the learning experience was higher from the SciPy conference in a "tough love" way. But I felt more of a sense of belonging and was happier at the PyData conference. I will also have a writeup of a couple of the tools/talks I found most useful from the SciPy 2018 conference.
DevEnv for Windows - Elegant-SciPy book:
I agreed to help Juan write a Windows OS version of "build" instructions for converting Markdown format files on GitHub to Jupyter notebooks, which are then saved as html or pdf book chapters, with or without output calculation cells. I tested several versions so far using conda virtual environment, partial bash tools for Windows, and the new Microsoft Windows Subsystem for Linux (for fully compatible bash scripts).
Note on Jupyter notebooks: MikTex package needs to be installed at "C:/Program Files" and the Windows environment variable, system path needs to be set to this directory. MikTex allows LaTex and some markdown formatting codes to work for saving Jupyter notebooks to html and pdf formats.
Proposed talk to Risk Managers:
Part 1) A quick overview of cool talks from SciPy and PyData conferences.
Part 2) A hands-on practical demos on the most useful AWS tools.
How to host your website on Amazon Route 53
How to run a Python program on Amazon Lambda
How to run a deep learning project on Amazon EC2
(Elastic Compute Cloud)
How to store your files on Amazon S3 (Simple Storage Service)
Bonus - how to share your project on GitHub, and how to find other people's projects.
Refactoring previous code to share on my portfolio
Random Walk charting demo
A sorting algorithm and analysis using Big-O
Game 2048 slider, using my custom images and class objects.
Python IO demo. Writing text files for controlling lab equipment settings.
Uploading previous R code for matrix calculation and data analysis

 It is a very opinionated book. And I don't agree with many of the author's views.
But it offers an interesting look inside the mind of a hedge fund manager trying to use Machine Learning to make money in 2018. The author pans natural language processing to conduct sentiment analysis on earnings calls or satellite image processing to obtain product delivery or sales quantity estimates. The author thinks the low hanging fruit from those methods are gone. He believes in processing raw trading data from the exchanges to discover trading fingerprints of humans vs algo traders, as well as other classes of traders. This can be used to create spread trading strategies where one class of traders can be expected to outperform another class of traders, under specific economic conditions. The Machine Learning part is used to automate raw data processing, where huge volumes are processed for the small nuggets of silver.
It is a very opinionated book. And I don't agree with many of the author's views.
But it offers an interesting look inside the mind of a hedge fund manager trying to use Machine Learning to make money in 2018. The author pans natural language processing to conduct sentiment analysis on earnings calls or satellite image processing to obtain product delivery or sales quantity estimates. The author thinks the low hanging fruit from those methods are gone. He believes in processing raw trading data from the exchanges to discover trading fingerprints of humans vs algo traders, as well as other classes of traders. This can be used to create spread trading strategies where one class of traders can be expected to outperform another class of traders, under specific economic conditions. The Machine Learning part is used to automate raw data processing, where huge volumes are processed for the small nuggets of silver. In brief, I read in an article that Fisher Black told someone close that the reason he decided not to join Long-Term Capital was because he thought their strategy boiled down to shorting liquidity. I have no way to verify whether he said this. However, after many years of thinking about it, I came to agree that LT Capital failed primarily because they were short liquidity. This is unusual. Most failures are primarily due to market risk or credit risk. Although almost all failures do have a liquidity risk component, this is a short-term effect caused by deteriorating asset values. In most failures, the main invested assets are later discovered to be fundamentally flawed and loses significant value. This did not happen in the LT Capital failure. The fund ran out of time, but the bulk of the positions were later sold at a profit. The instigating event was probably the Russian government's decision to devalue its currency and default on its government bonds, while simultaneously enforcing a bank freeze on all assets held inside its border. The NY FED lead an effort to arm-twist major banks, who were investors in LT Capital, to allow it to take more time to resolve its obligations. The regulators were very concerned about systemic risk. Some people believe this FED action added to moral hazard, and may have contributed to the Market Crash of 2008. I think we can only have an imperfect understanding of what happened then, and all of its interconnections and ramifications, even though this case has been extensively studied and reported on.